Spare parts for Viessmann-controls are quite expensive. As the control of our oil-heater has broken down, I searched for a replacement but in the end I developed a full replacement with MQTT and connection to NodeRED.
Basics of heating-control
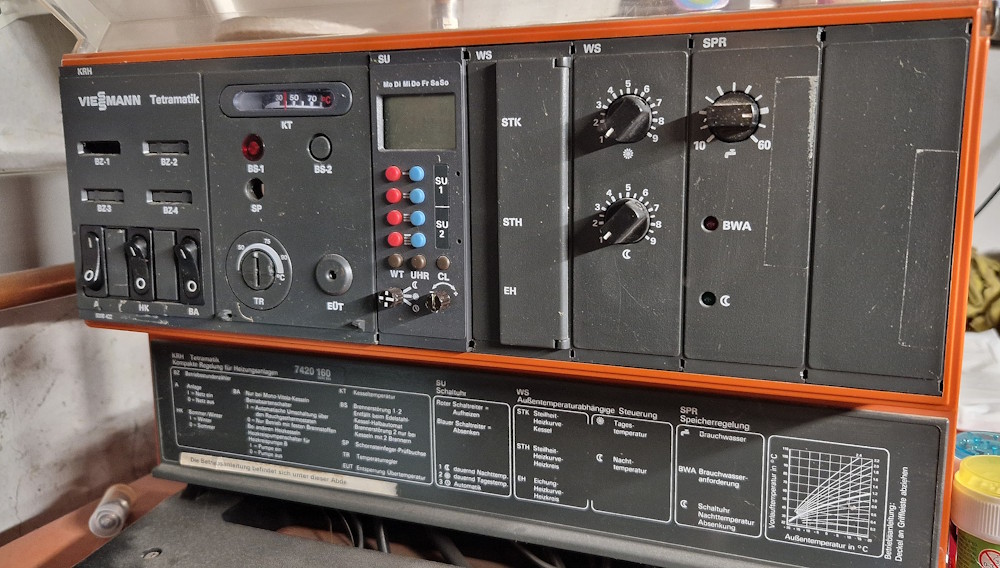
In the 70s the boiler double thermostat was state of the art in german houses. So the heating started when the water-temperature was below a specific threshold and it stopped above a second threshold. In newer designs an outdoor-sensor detects the temperature at the outside and a heating-curve controls the forward water temperature shown in the following picture:
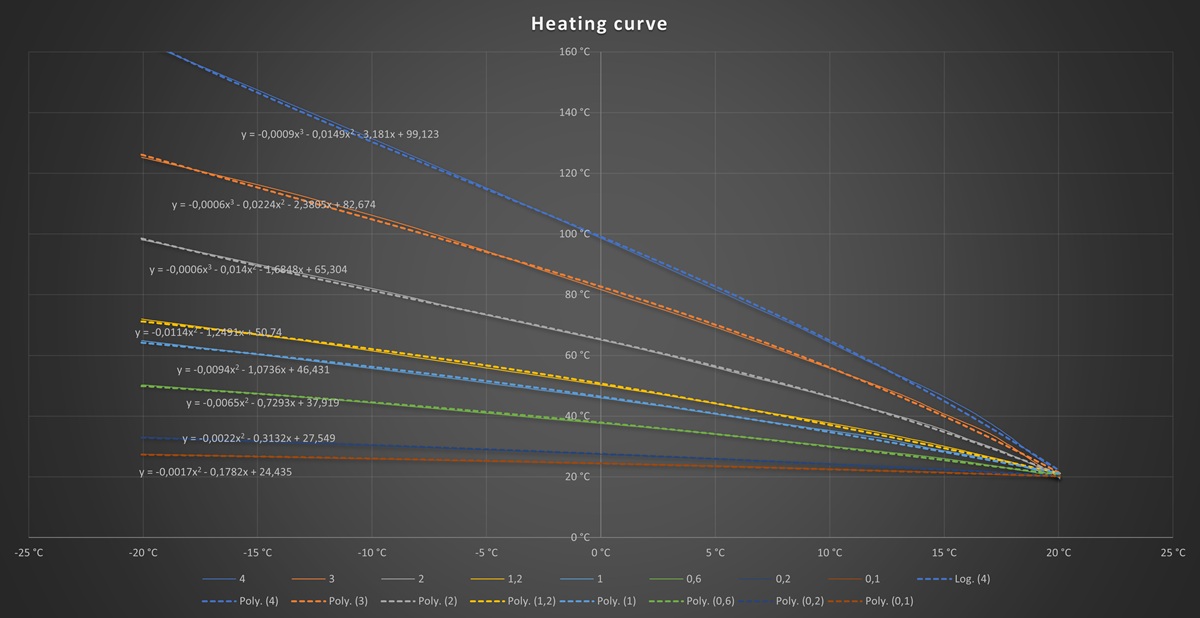
These curves plot the necessary forward water temperature at different inclinations. The inclination is depending on how good the house is insulated against the outside: a good thermal insulation results in a smaller inclination (lower forward water temperature) and vice versa. Next to the inclination this heating curve can be shifted using a temperature-offset for the X and Y axis to match the needs for the individual situation.
Together with a water mixing device the forward water temperature can be adjusted to the necessary energy to keep the house at the desired temperature without wasting energy.
As our heating control stopped working, I searched for replacement parts but realized, that even quite old Viessmann controls cost around 500€ to 600€ - more modern devices more than 1000€ - too much in my opinion. So I had a deeper look at what our old control was doing:
- Measure temperature of the outside
- Measure temperature of the boiler temperature
- "Calculate" the heating curve
- Start/Stop the boiler
- Load the hot-water-tank if water-temperature is too low
- A Safety temperature limiter prevents water to be heated up above a maximum value
- Manual override for the chimney sweeper
That's basically it. Not much for 600€.
Hardware basis for the new controller
This short list in mind I thought about a DIY controller keeping the original functions and adding some more up-to-date features:
- all of the above functions
- control via ethernet / smartphone
- present measurements in nice graphs
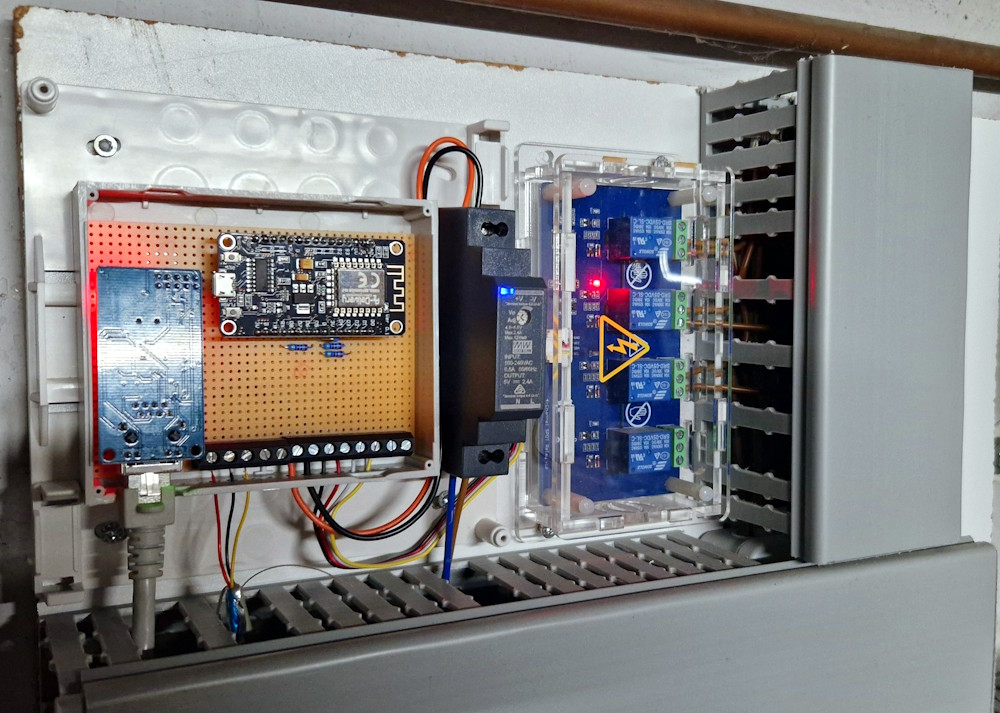
As development basis I love the Arduino IDE and selected a compatible microcontroller with low energy-demand: the ESP8266. This device has support for WiFi, but to ensure a good connection I wanted to add ethernet as an additional connection. So I added a W5500 ethernet-connector from WIZnet to the ESP8266, as there is a compatible library for the ESP8266 available.
In Germany all oil-heaters have a separate control unit that controls the oil-temperature, the amount of air, the ignition-process and the flame-controlling. So I just had to implement a control to enable this control unit. For this I added a relay-board via I2C:
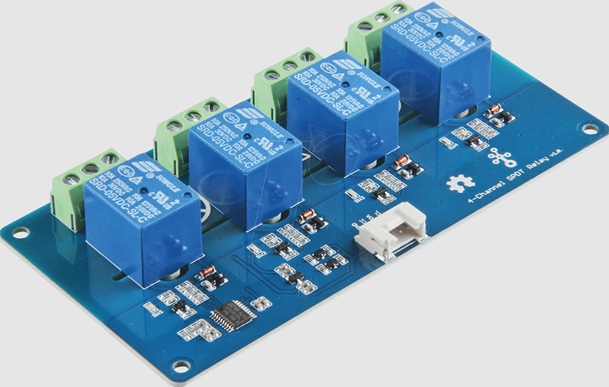
For measuring the individual temperatures of the boiler, the water in the forward- and backward-path as well as the outside, I bought several DS18B20 sensors, that are well supported by several Arduino libraries using the OneWire-protocol. With these few components my new DIY heating control had connections to the 230V-domain of the old oil-heater, sensors and two connections to my network.
Developing new controller based on ESP8266
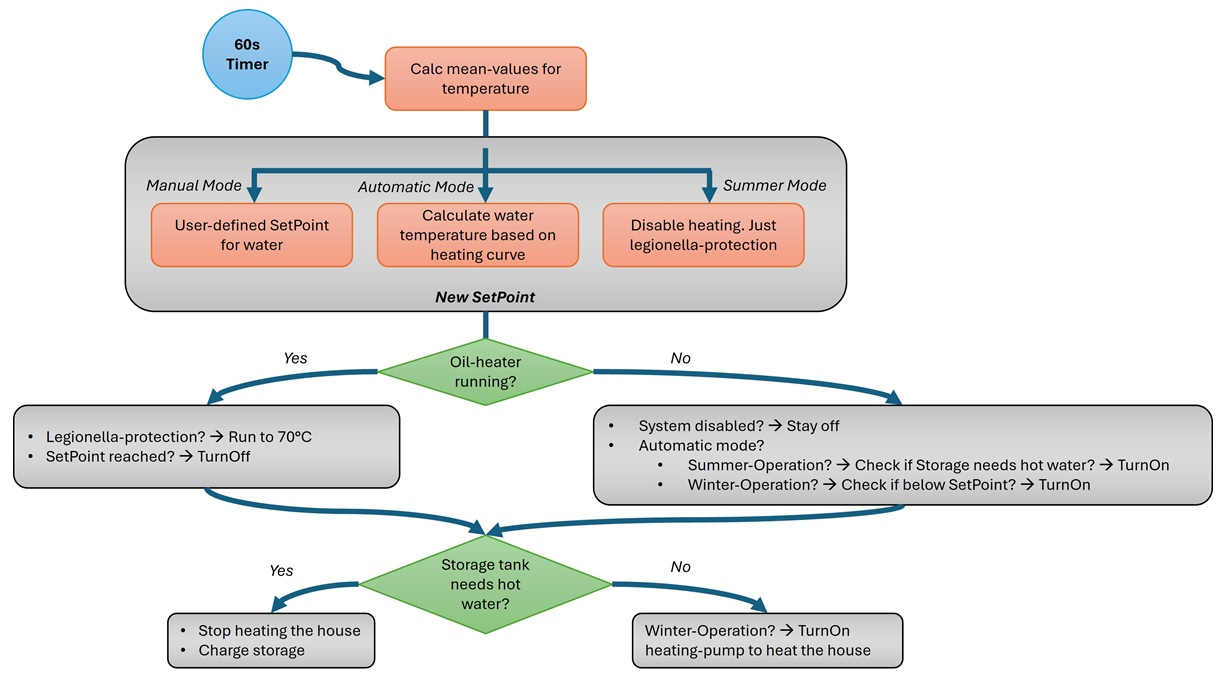
Now that the hardware basis is ready I had to program all important features for controlling the water-temperature within the boiler. As the oil-heater has no control over the power, it will always heat the water with 100% power or turn off. So the most important feature of the new control was a simple two-point controller to control the water-temperature within the boiler. As the water-temperature at the sensor has some time constant to be the right value, I implemented a quite slow timer, that takes a snapshot of the individual temperatures every 60 seconds. Within this service-function, the following things are done:
- Step 0: check the relay-state via I2C
- Step 1: calculate the mean-value of the temperatures that are read every 15 seconds
- Step 2: calculate the new setpoint-value based on the heating curve
- Step 3: ignite the boiler if water temperature is below setpoint
- Step 4: start or stop charging the water storage
- Step 5: start or stop heating the house
The implemented state-machine has some additional states for summer- and winter-operation as well as a manual override:
To calculate the forward-temperature the above heating-curve was implemented using a polynomial equation:
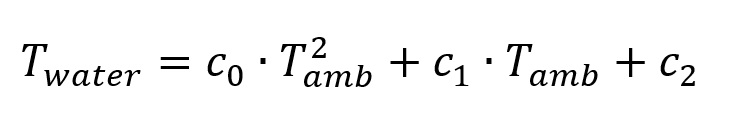
The coefficients c0 to c2 were determined using Excel and the original heating-curve. As I was not sure which inclination of the heating-curve are correct for our 200-year-old house, I've implemented the coefficients for heating-curves with inclinations between 0.1 and 4 - in total 14 different sets of coefficients.
float calcForwardTemperature(float tempOutdoor, uint8_t tilt, int8_t moveX, int8_t moveY) {
  // 1=0.1, 2=0.2, 6=0.6, 12=1.2, 20=2.0, 40=4.0
  float local_tempOutdoor = tempOutdoor + moveX;

  if (local_tempOutdoor>20) {
    return 20; // we do not have to heat, so return 20°C
  }else{
    float x=local_tempOutdoor;
    float x2=x*x;
    float x3=x2*x;
    float flowTemperature=0.0f;

    switch (tilt) {
      case 1:
        flowTemperature = -0.0017f*x2 - 0.1782f*x + 24.435f;
        break;
      case 2:
        flowTemperature = -0.0022f*x2 - 0.3132f*x + 27.549f;
        break;
      // more cases
    }

    flowTemperature = flowTemperature + moveY;

    if (flowTemperature<=heater.setup.maxBoilerTemperature) {
      return flowTemperature;
    }else{
      return heater.setup.maxBoilerTemperature; // limit to maximum temperature
    }
  }
}
Over a couple of months during the winter in 2022 I found out that an inclination of 0.6, an X-shift of -3 Kelvin and a Y-shift of +14 Kelvin was fine for our house with four levels and 15 rooms - damn good for a 200-year old house. But I have to mention that we've renovated and insulated the roof with 25cm rockwool in 2006. The following diagram shows the corrected heating-curve for our house in white - the original curves are the dotted curves:
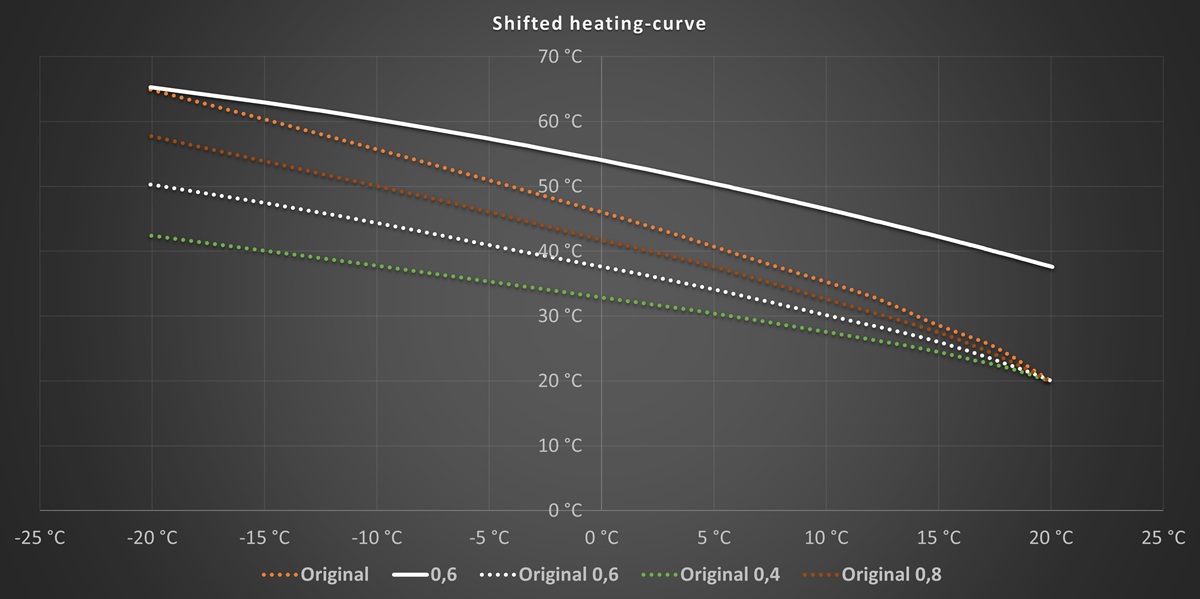
This means if the ambient temperature is -10°C, our heating will control the forward water temperature to +60°C and when the ambient temperature is +5°C, the water will have a temperature of 50°C. As our house has no mixing device, the temperature will be controlled over the boiler-temperature.
If the temperature of the connected water storage tank drops below a user-defined threshold, a pump will transfer hot water from the boiler to the storage. This will take about 10 to 15 minutes. If the temperature within the boiler is dropping, the oil-heater will be engaged and the water is heaten up.
Connection to my local network
Now that I had a working heating-control again, I thought about programming a nice user-interface. I started working on an individual webinterface but just in time I found out, that NodeRED already brings a very nice user interface. As NodeRED works very well together with an MQTT-broker, I installed Mosquitto on my Linux-server and used the Arduino-library PubSubClient to implemented MQTT to my control.
The PubSubClient library is very easy to use: with only some small lines of code the ESP8266 connects to my MQTT-broker and publishes data:
PubSubClient mqttclient(mqttnetworkclient);

// configure MQTT-client
mqttclient.setServer("192.168.0.xxx", 1883);

// send/publish data
mqttclient.publish("heating/temperature/ambient", String(heater.values.temperatures.ambient).c_str());
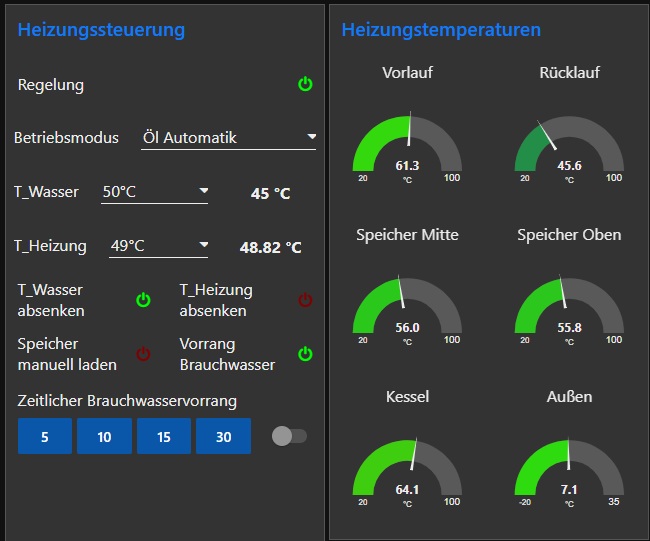
It took some hours but I implemented all functions using MQTT: desired temperatues, mode-selection, publishing of all temperatures and status-information like the duration of the water-heating-process. In the end the user-interface of NodeRED could display the current state of my heating-control as well as the individual temperatures:
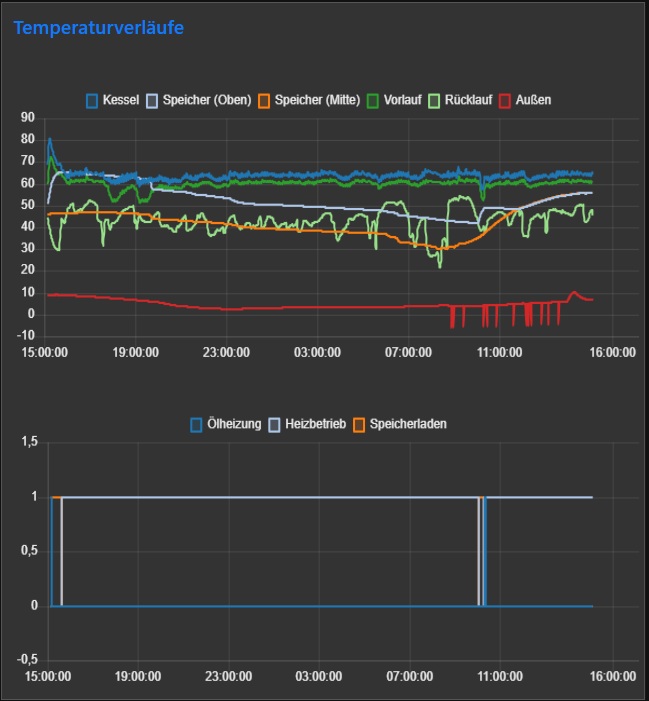
Besides this NodeRED also offers some time-series-functions to get an overview of the development of the heating - way more features, than the old Viessmann control could ever offer:
Graphs using InfluxDB and Grafana
The graphical functions of NodeRED are fine for time-series over a couple of hours, but not for long-term series. While searching for information about NodeRED I realized, that InfluxDB is a database very well suited for time-series - even over very long periodes. InfluxDB already brings some UI, but most of the time Grafana is the choice for most users so I gave it at try. And it is working well. Within NodeRED all incoming data is processed and using a fixed step-time the data is put into the InfluxDB on my Linux-server.
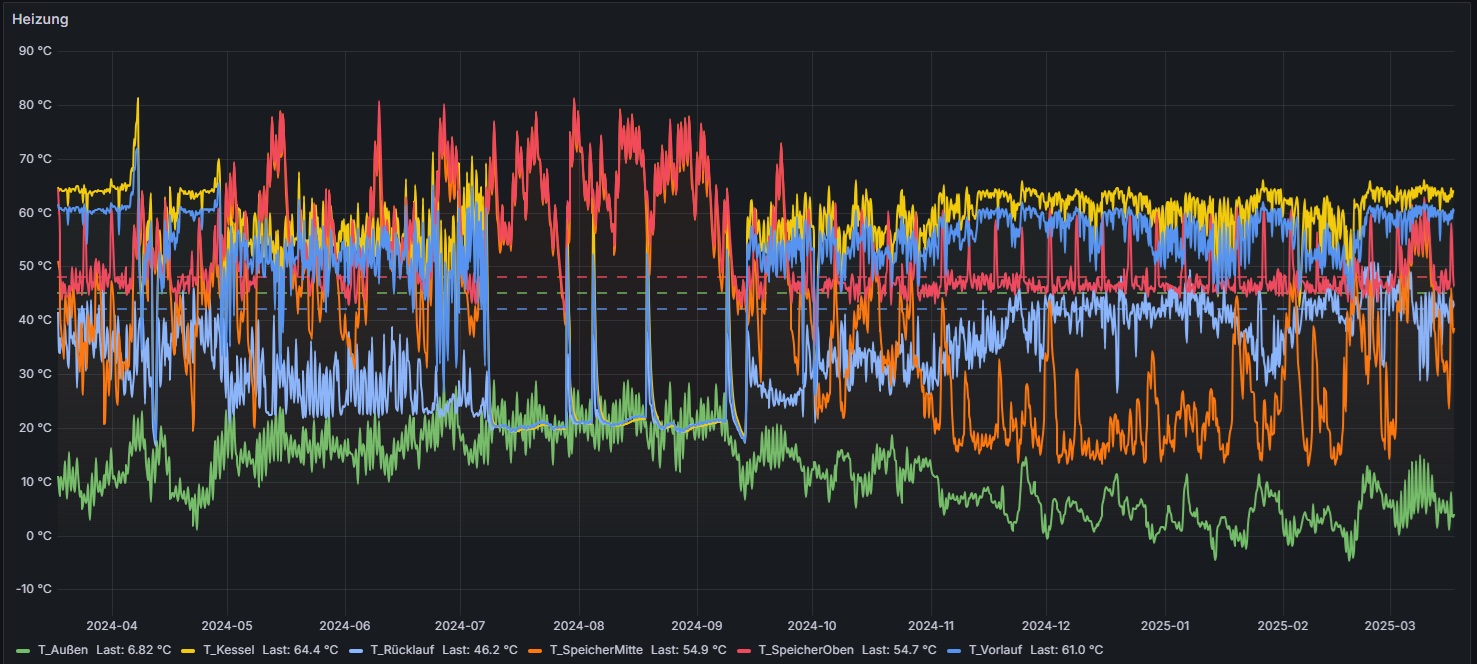
As soon as I want to look at a time history, I open the prepared Grafana page, which then connects to InfluxDB and displays the desired time period in a very appealing way. The following graph shows all heating-relevant data over 12 months, while the graph is interactive and plots can be enabled/disabled by click as well as the zoom can be changed via Click&Drag:
Additional features
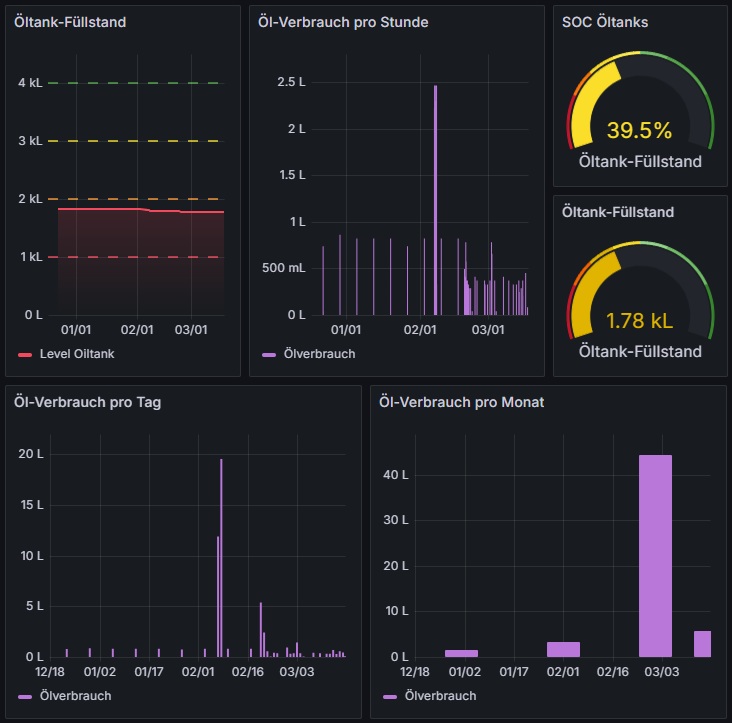
As NodeRED has knowledge about the duration of the heating-process now and the oil-heater is operating in a digital manner (on or off) I had a look into the datasheet of the used oil-nozzle and found information about the oil-consumption over the time. With this information I was able to implement a oil-consumption graph and now I'm able to keep track on the SOC (State-Of-Charge) of the oil-tanks as well. In the following picture you can see oil-consumption per hour in the center and the tank-level over the time in litre on the left. The lower graphs show the oil-consumption per day and month - just different view-options by Grafana:
Now that I had full control over the oil-heater, I was able to add additional functions the original system did not have. As in water legionella can grow if the water is not hot enough, I implemented a legionella-killer-function: every sunday the oil-heater heats up the water-storage up to 70°C to kill legionella within this storage. The timing is such that we can give our children a good bath with plenty of warm water on Sunday evening. This minimizes the need for resources.
Outlook
This project has proven that it is possible to create individual IoT solutions that can replace professional control-units. The Arduino-libraries are are very good basis for these kind of projects and offers lot of different functions. Together with a small linux-based server (RaspberryPi or a small Embedded PC) a very powerful data-aquisition tool can be generated. And together with MQTT and NodeRED this system is very scalable, too.
But the most important thing I did not mention up to now: the safety. Working with oil or gas in combination with electric energy could be harmful and dangerous. I implemented several safety-functions inside the code but the ESP8266 could hangup or have malfunctions. For this I kept the original safety temperature limiter that is in series to the powerline of the oil-heater. If the water-temperature rises above 70°C this limiting-device disconnects the power of the oil-heater and disables it immediately, preventing the water to produce steam which could result in a destruction of the heater itself.
Comments